

Creating eye-catching infographics has never been easier, thanks to the Canva Infographic Creator. Did you know that about 65% of people are visual learners? That’s why infographics are such a powerful tool for sharing information; they make complex data easy to understand and visually engaging. Canva is a popular online design platform that allows anyone, even without design experience, to create professional-quality infographics for free.
With the Canva Infographic Creator, you can transform your ideas into stunning visuals quickly and easily. In this guide, you’ll learn everything you need to know about using the Canva Infographic Creator, from getting started to advanced design tips and best practices. Whether you’re a beginner, marketer, educator, or business owner, this article will help you unlock the full potential of Canva’s infographic tools and create impressive visuals that stand out.
What is the Canva Infographic Creator?
The Canva Infographic Creator is a user-friendly tool within the Canva platform designed specifically for making infographics. It provides a vast library of templates, design elements, and customization options, making it simple for anyone to create professional-looking infographics. Canva is known for its free and premium versions, with most infographic templates available for free. The platform stands out because it combines simplicity with powerful features, allowing even those with zero design skills to produce polished results. Infographic searches have increased by 800% in recent years, and infographics are often shared widely on social media due to their viral potential.
The Canva Infographic Creator is perfect for beginners, marketers, educators, and businesses looking to present data, tell stories, or promote products. The freemium model means you can access many tools for free, but premium features (like advanced templates and extra graphics) require a paid subscription. When using Canva, it’s easy to tell which content is free and which is paid. Paid elements are usually marked with a dollar sign or lock icon. With its intuitive interface and huge template library, Canva makes infographic creation accessible to everyone.
Getting Started with Canva Infographic Creator
Jumping into infographic design is easier than ever with Canva. Whether you’re a beginner or a pro, this guide will walk you through the basics.
Creating Your Canva Account
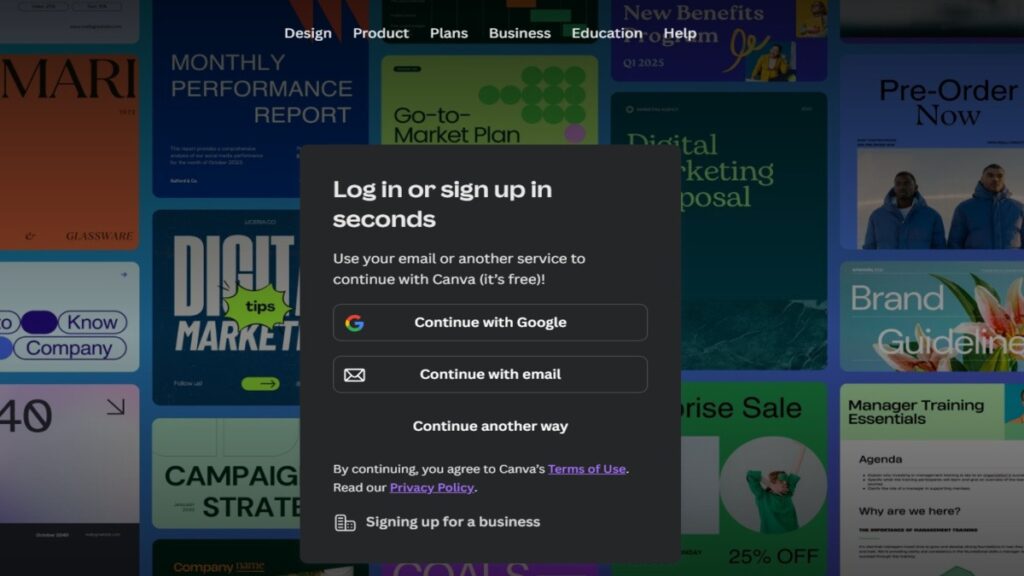
To start using the Canva Infographic Creator, you’ll need to create a free Canva account. You can sign up using your Google, Facebook, or email address, which makes the process quick and simple. Once you’re signed in, you can personalize your account and start exploring the platform. Setting up your account is straightforward, and you’ll have access to a dashboard where you can manage all your designs.
Accessing the Infographic Creator
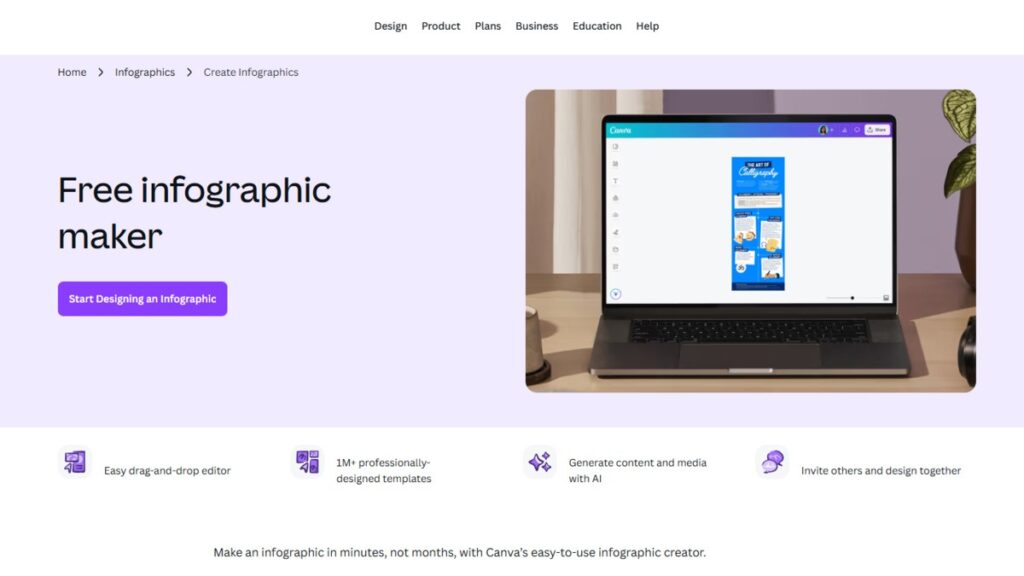
After logging in, navigate to the infographic section by searching for “infographic” in Canva’s template library. You’ll find hundreds of infographic templates to choose from, covering topics like statistics, timelines, comparisons, and more. The default infographic dimensions are usually 800 x 2000 pixels, but you can also select custom sizes for different platforms, such as social media or print.
Choosing Between Templates vs. Starting from Scratch
Canva’s infographic templates are a great starting point, especially if you’re new to design. These templates are professionally designed and customizable, so you can quickly change colors, fonts, and content to match your needs. If you prefer more creative control, you can start with a blank canvas. When choosing a template, consider the color scheme, layout, and how well it fits your target audience.
In this section, you’ll learn how to set up your Canva account, access the infographic creator, and choose between templates or a blank canvas.
Essential Tools in Canva Infographic Creator
The Canva Infographic Creator is loaded with tools that help you design beautiful infographics without needing advanced skills. Let’s break down the main features you’ll use most often.
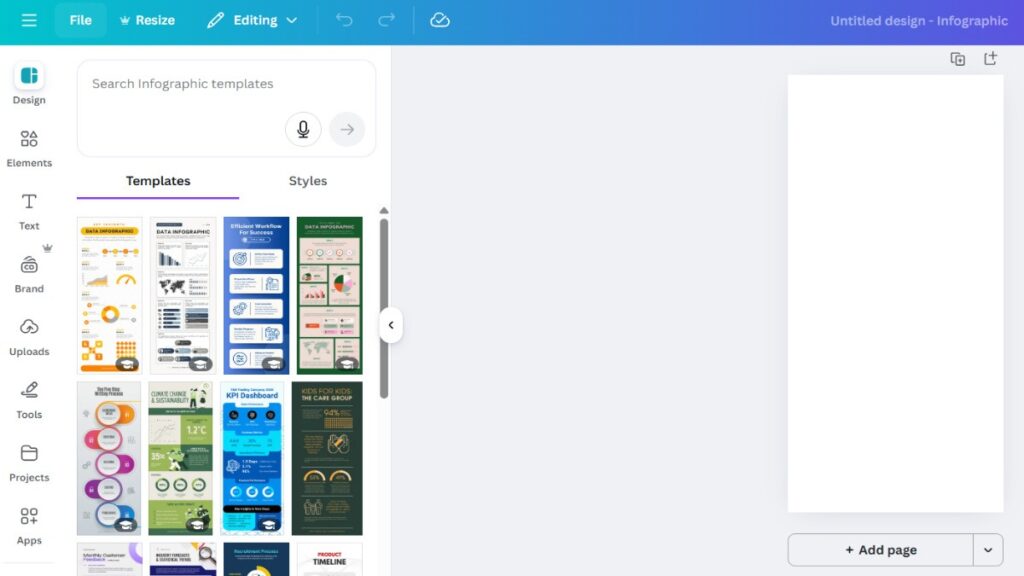
Navigation and Interface Overview
The Canva Infographic Creator features a clean interface with a left sidebar for design elements, a top toolbar for editing, and a central canvas workspace where you build your infographic. The sidebar lets you access photos, icons, shapes, and more, while the toolbar offers options for formatting, resizing, and layering your elements.
Design Elements Library
Canva offers over 2 million stock photos, thousands of icons and illustrations, and a wide variety of shapes and lines to help you create visually engaging infographics. You can also use grids and frames to organize your content and make your design look more professional.
Charts and Data Visualization Tools
The Canva Infographic Creator includes built-in chart tools for bar charts, line graphs, and pie charts. You can upload your data from a spreadsheet or CSV file, or connect to Google Sheets for real-time updates. Charts can be customized with different colors and styles to match your infographic’s theme.
Background and Color Tools
You can select from a wide range of background colors, patterns, and designs. Canva also provides color palette suggestions based on color psychology principles, helping you choose colors that evoke the right emotions. You can even upload your brand colors for consistency.
Magic Studio and AI Features
Canva’s Magic Studio includes AI-powered tools like Magic Switch, which lets you quickly resize your infographic for different platforms. The platform also offers design suggestions and quick customization options to speed up your workflow.
Best Practices for Designing Infographics in Canva Infographic Creator
Knowing the best practices will help you create infographics that are not only beautiful but also effective at communicating your message.
mContent and Research
Always use credible sources and fact-check your information before creating your infographic. Break down complex data into digestible sections and aim for no more than six main points to keep your design clear. Creating a clear narrative or story arc will help your audience follow along.
Visual Design Principles
Embrace white space to avoid overcrowding your design. Maintain visual hierarchy by making important elements stand out. Use high-contrast colors for better accessibility, and keep your design elements consistent throughout.
Color Strategy
Apply color psychology principles blue for trust, red for urgency, green for growth. Limit your color palette to three to five colors for a clean look, and make sure your brand colors are consistent.
Data Visualization Tips
Choose the right chart type for your data (bar chart for comparisons, pie chart for percentages). Make statistics visual by using icons and pictograms, not just numbers.
Typography Guidelines
Establish a clear text hierarchy with headings, subheadings, and body text. Mix font styles sparingly two or three fonts are enough for most infographics. Ensure your text is readable on all devices.
Layout and Flow
Create a visual pathway that guides readers through your infographic. Include a compelling call-to-action and tell your story with a logical progression.
Focused content and a strong narrative make your infographic more engaging and easier to understand.
Optimizing Infographics for Different Platforms
Tailoring your infographic for each platform maximizes its impact:
- Blog posts: Use dimensions like 663 x 2000 px for optimal display.
- Facebook: 1200 x 628 px works best for posts.
- LinkedIn: 1104 x 736 px is ideal.
- Instagram Stories and posts: Use square or vertical formats.
- Twitter/X: Stick to 1200 x 675 px.
- Pinterest: Optimize for tall images, like 1000 x 1500 px.
- Email marketing: Keep infographics simple and mobile-friendly.
Conclusion
The Canva Infographic Creator is a powerful, user-friendly tool that makes creating professional infographics simple and accessible for everyone. Whether you’re a beginner or a seasoned designer, you can create stunning visuals that grab attention and communicate your message effectively.
With its wide range of templates, design tools, and customization options, the Canva Infographic Creator empowers you to experiment, practice, and iterate until you get the perfect result. Start creating your first infographic today and see how easy it is to turn your ideas into engaging visuals.
Leave a Reply